-1.png?width=50&name=Untitled%20design%20(32)-1.png)
Deeper dives into prices and worker pay show that the war against inflation is not yet won. There...
Often considered an important indicator of our economic future, the yield curve has experienced a major transformation as of late
The yield curve has undergone a seismic shift over the past few months. Many investors place significant importance on the yield curve’s power as a gauge of future economic conditions, so changes are often seen as significant signals about the road ahead. To understand more about what the changing yield curve says about our economic future, it’s helpful to establish what it is and why it’s important.
The yield curve is a graphical representation of the relationship between interest rates for bonds of different maturity dates, ranging from as short as one month to as long as 30 years. In most cases, the interest rates for longer-dated bonds are higher than those with shorter time horizons. This is because bond investors expect to be compensated for risk, such as inflation or the potential for default. The longer the term of a bond, the more risk investors are exposed to.
So, a “normal” yield curve tends to slope upward. The graph below shows an approximate example:

Source: author’s estimates; for illustrative purposes only
At a basic level, the yield curve shows what investors expect about interest rates in the future. The most common version of the yield curve depicts interest paid on bonds issued by the U.S. Treasury. It’s an important distinction, as the probability of a federal government default is near zero (despite all of the doomsday talk about the debt ceiling). This means treasury yields reflect investor thinking about interest rates in relation to broad economic factors like inflation, economic growth, and the Fed.
An upward sloping yield curve is an indication that investors expect the economy to grow in the future. Economic growth typically comes with some inflation, which means the Fed might need higher interest rates to prevent runaway growth that creates problematic inflation. These expectations are reflected by higher yields at the long end of the curve, as in the normal case.
But, as we’ve grown all too accustomed to hearing as of late, our current economic reality is not what we might consider normal. This abnormality is reflected in the shape of today’s yield curve, which inverted a few months ago and has remained that way since. Inversion of the curve happens when shorter-dated bonds have higher yields than those with longer time horizons.
Historically, an inverted yield curve has been an imperfect but popular predictor of recessions as it signals investor pessimism about the near-term future of economic growth. Investors typically demand less return from longer bonds than shorter bonds when conditions are expected to deteriorate, as the Fed is likely to cut rates after the economy shows signs of slowing.
The graph below shows the current U.S. treasury yield curve compared to what it looked like a year ago. The teal line represents yields on March 1st 2023, and the purple line shows yields from March 1st 2022.
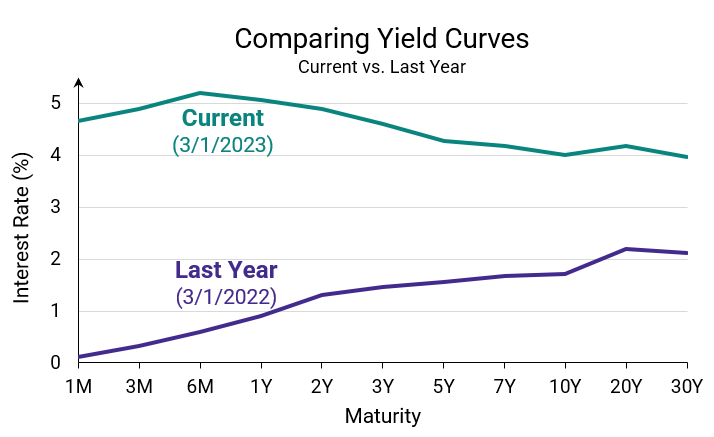
Source: www.ustreasuryyieldcurve.com; curves represent yields for U.S. treasuries at stated maturities from dates listed above
As the Fed continues to battle rising prices by slowing the economy with higher short-term interest rates, the economic outlook has soured and shorter rates have surged. Today’s inverted curve is a reflection of investor expectations that the economy will slow in the near-term. And this is consistent with the Fed’s plan—it’s just hoping to slow the economy enough to cool inflation without creating a significant downturn that causes widespread economic harm.
Whether a recession is imminent is impossible to say, but the near-term outlook from investors doesn’t paint a rosy picture. Taking our interpretation of the yield curve another step leads us to see that investors do expect the Fed to have at least some success in reeling in rapid price growth, as long-term yields are lower than both the Fed’s current policy rate and the rate of inflation today.
So, what does this all mean for investors? As The Waterwheel is keen to point out, the prospect of benefitting from the long-term potential of the U.S. economy remains strong. But the current interest rate environment has important implications for investors, particularly those who hold cash and bonds.
Higher short-term rates mean investors can once again enjoy moderate returns on cash-like investments such as money market funds, bank CDs, and short-term treasuries. And while longer rates are now lower than those of shorter bonds, long bonds still provide investors an opportunity to lock in significantly higher rates today than almost any other time over the past 15 years.
Of course, uncertainty exists. The Alesco Advisors investment team currently has most client bond portfolios positioned at a duration slightly shorter than the market average. This means our client bond portfolios tend to be less exposed to the risk of rising interest rates, yet they still stand to benefit from holding longer bonds at relatively attractive rates.
Despite near-term uncertainty in the market, the long-term outlook for holding bonds as part of a diversified portfolio is strong. Investors should work with an investment professional to develop an appropriate plan to benefit from the long-term potential of U.S. capital markets.