-1.png?width=50&name=Untitled%20design%20(32)-1.png)

With interest rate cuts on the horizon, it’s important to focus on what matters
The stories of our last three recessions can help us understand what the next downturn may (or may not) look like.
Fears of a looming recession have taken hold of hearts and minds in recent days. Consumer confidence has plummeted, the stock market is floundering, and the Fed continues to openly discuss the possibility of an economic downturn.
To be clear, the economy is still growing. But several factors do point to a higher risk of recession as of late, which means our current economic growth might not last much longer.
So what is a recession? Simply put, a recession is a period when the economy shrinks. The technical definition is a period of economic decline lasting at least two quarters, or six months.
We expect economic activity to grow over time, which is typically the case. When it’s not growing, things get hard: consumers pull back on spending, businesses lay off workers, and many people suffer some form of economic hardship.
Recessions are uncommon, but they’re not rare—there have been five over the last 40 years in the U.S. And, while all are unpleasant, no two are the same.
To better understand the unique dynamics of each recession, economists look at three “D’s”: depth, duration, and diffusion. Differences in these characteristics lead to vastly different experiences for people during a downturn, which is important to recognize.
The chart below tells the general story of the last three U.S. recessions by tracking the relative levels of economic activity over time. The black line represents the starting level at the onset of each recession.
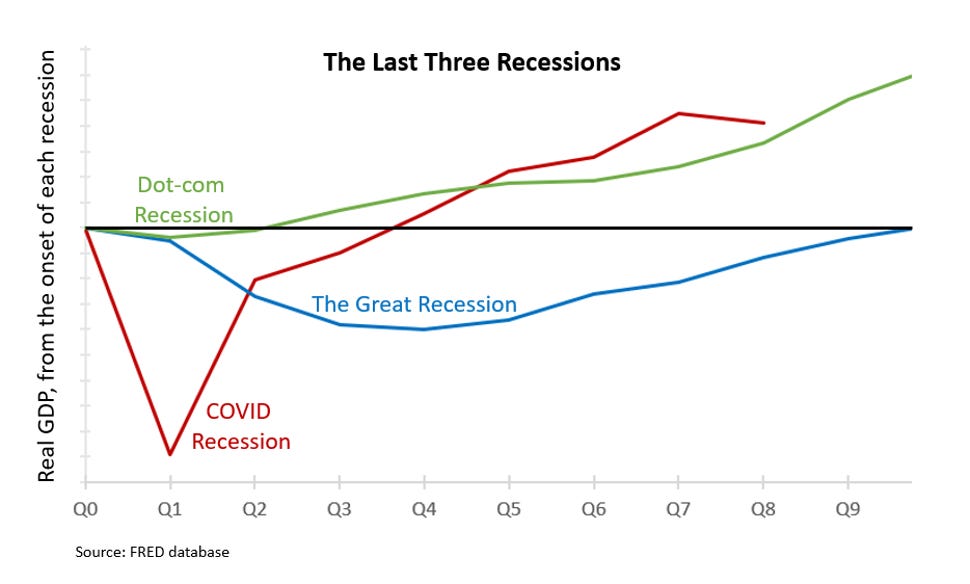
The red line above shows the path of our economy from the beginning of the COVID Recession in 2020. Notice how deep the decline in economic activity was compared to the others. While most industries suffered during the darkest days of shutdowns, service industries were hit the hardest. The economy recovered to pre-pandemic levels within a year and has continued to grow at a strong pace.
The blue line in the chart represents economic activity during the Great Recession in 2008. While this recession began due to a crisis in the housing market, the damage quickly diffused to nearly every other industry. Notice how long the recession lasted, as the economy took more than two years to recover. Even after the economy recovered, unemployment remained high and wages floundered for years.
Finally, the green line above shows economic activity from the start of the Dot-com Recession of 2001. This recession was brought on by widespread failures of online companies in the early days of the worldwide web. The effects of these failures were enough to bring the economy into a shallow recession, but the worst of the damage was mostly limited to online companies and the stock market. Economic activity recovered quickly and continued its typical pattern of growth in the years after.
While each of these episodes represents a recession, differences in depth, duration, and diffusion led to different experiences for those who lived through them.
So what does this mean for us now? For one, the economy is still growing, so talk of an impending recession is speculation. While some indicators might point to the elevated risk of a downturn, no one has a crystal ball.
Many factors weigh heavily on our current state: widespread inflation, global supply-chain issues, geopolitical uncertainty, and Federal Reserve policy, to name a few. There are also signs of strength such as resilient consumer spending, strong household finances, and a robust job market. Each of these stands to have some impact on the course of our economic future.
No matter what, the next recession—whenever it comes—will be different than ones we’ve experienced in the past. The depth, duration, and diffusion of the downturn will have important consequences for us all.
Stay tuned, more to come.